Student Services Building Remodel Student Services are temporarily located in alternate locations.

Student Services Building Remodel Student Services are temporarily located in alternate locations.
Purpose: Equitable distribution of CARES funds.
Fresno City College used Tableau to analyze disaggregated student data to inform the distribution of CARES funds. The data exclude students from the following categories: Fully online students, Dual/Enrichment, ISA’s, and current employees.
This shows the headcount of currently enrolled students taking all or the majority of courses at FCC (exluding students who were already enrolled in all online coursework prior to the shift to distance education)
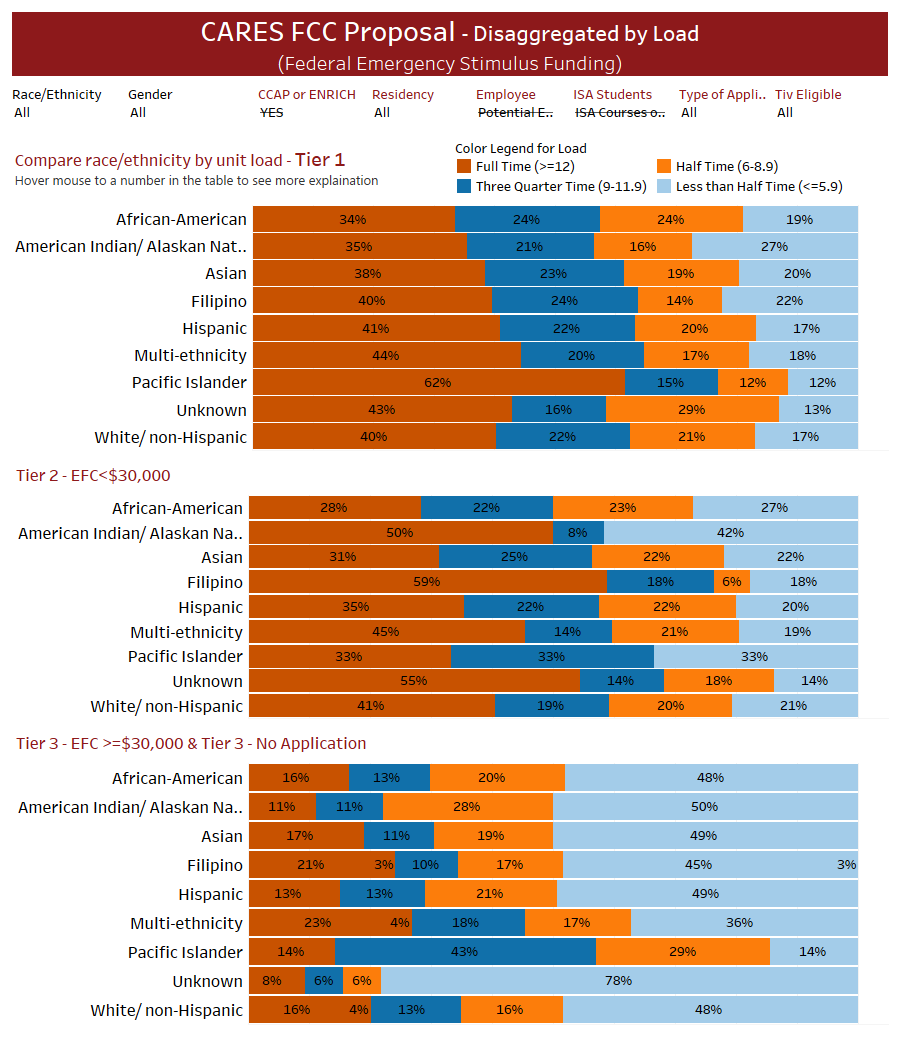
| Tiers | Full Time (>=12) | Three Quarter Time (9-11.9) | Half Time (6-8.9) | Less than Half Time (<=5.9) | Grand Total |
|---|---|---|---|---|---|
| Tier 1 - EFC<$5,776 | 4,402 | 2,432 | 2,194 | 1,904 | 10,932 |
| Tier 2 - EFC<$30,000 | 724 | 419 | 424 | 406 | 1,973 |
| Tier 3 - EFC >=$30,000 | 94 | 26 | 16 | 14 | 150 |
| Tier 3 - No Application | 553 | 494 | 725 | 1,823 | 3,595 |
| Grand Total | 5,773 | 3,371 | 3,359 | 4,147 | 16,650 |
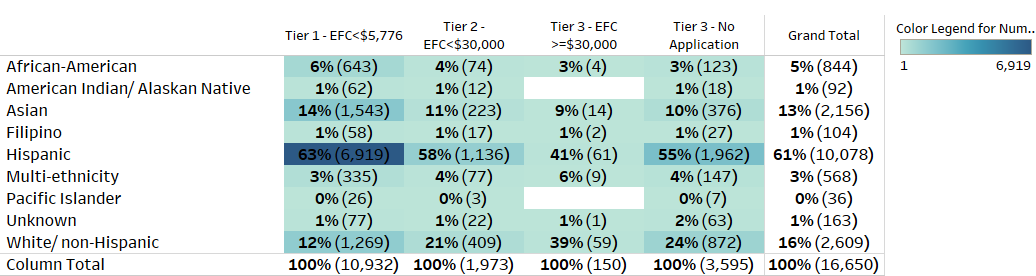
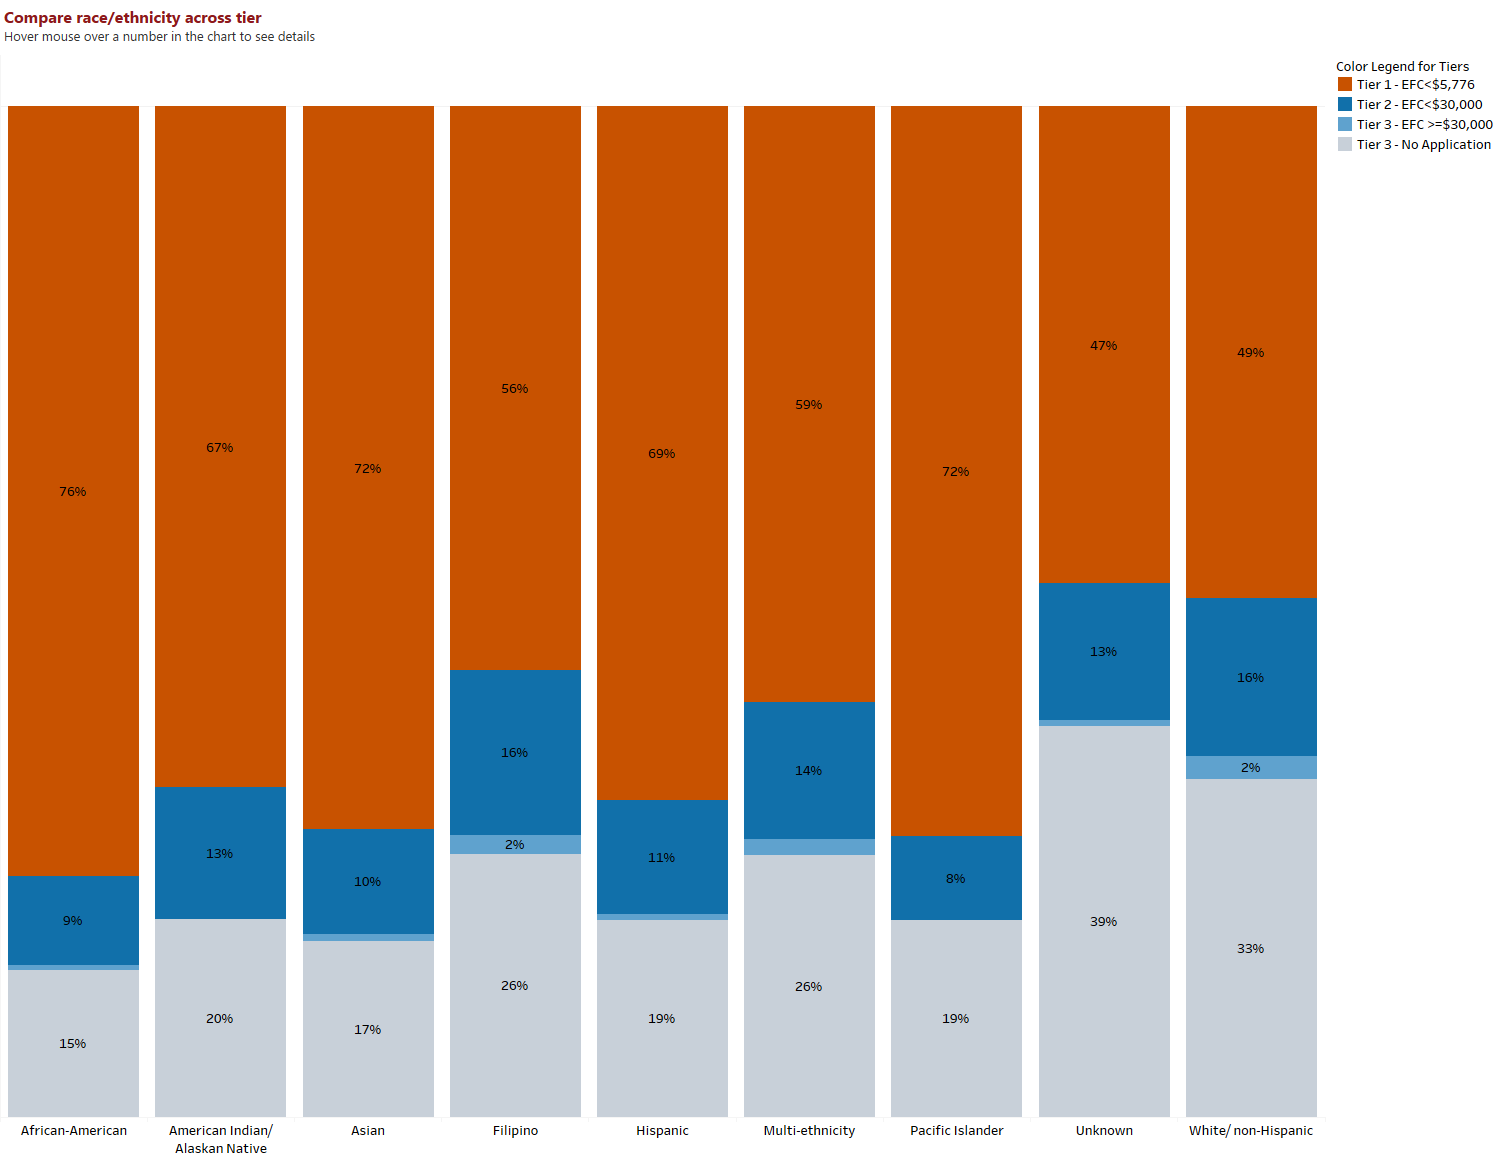
Compare race/ethnicity within tier.
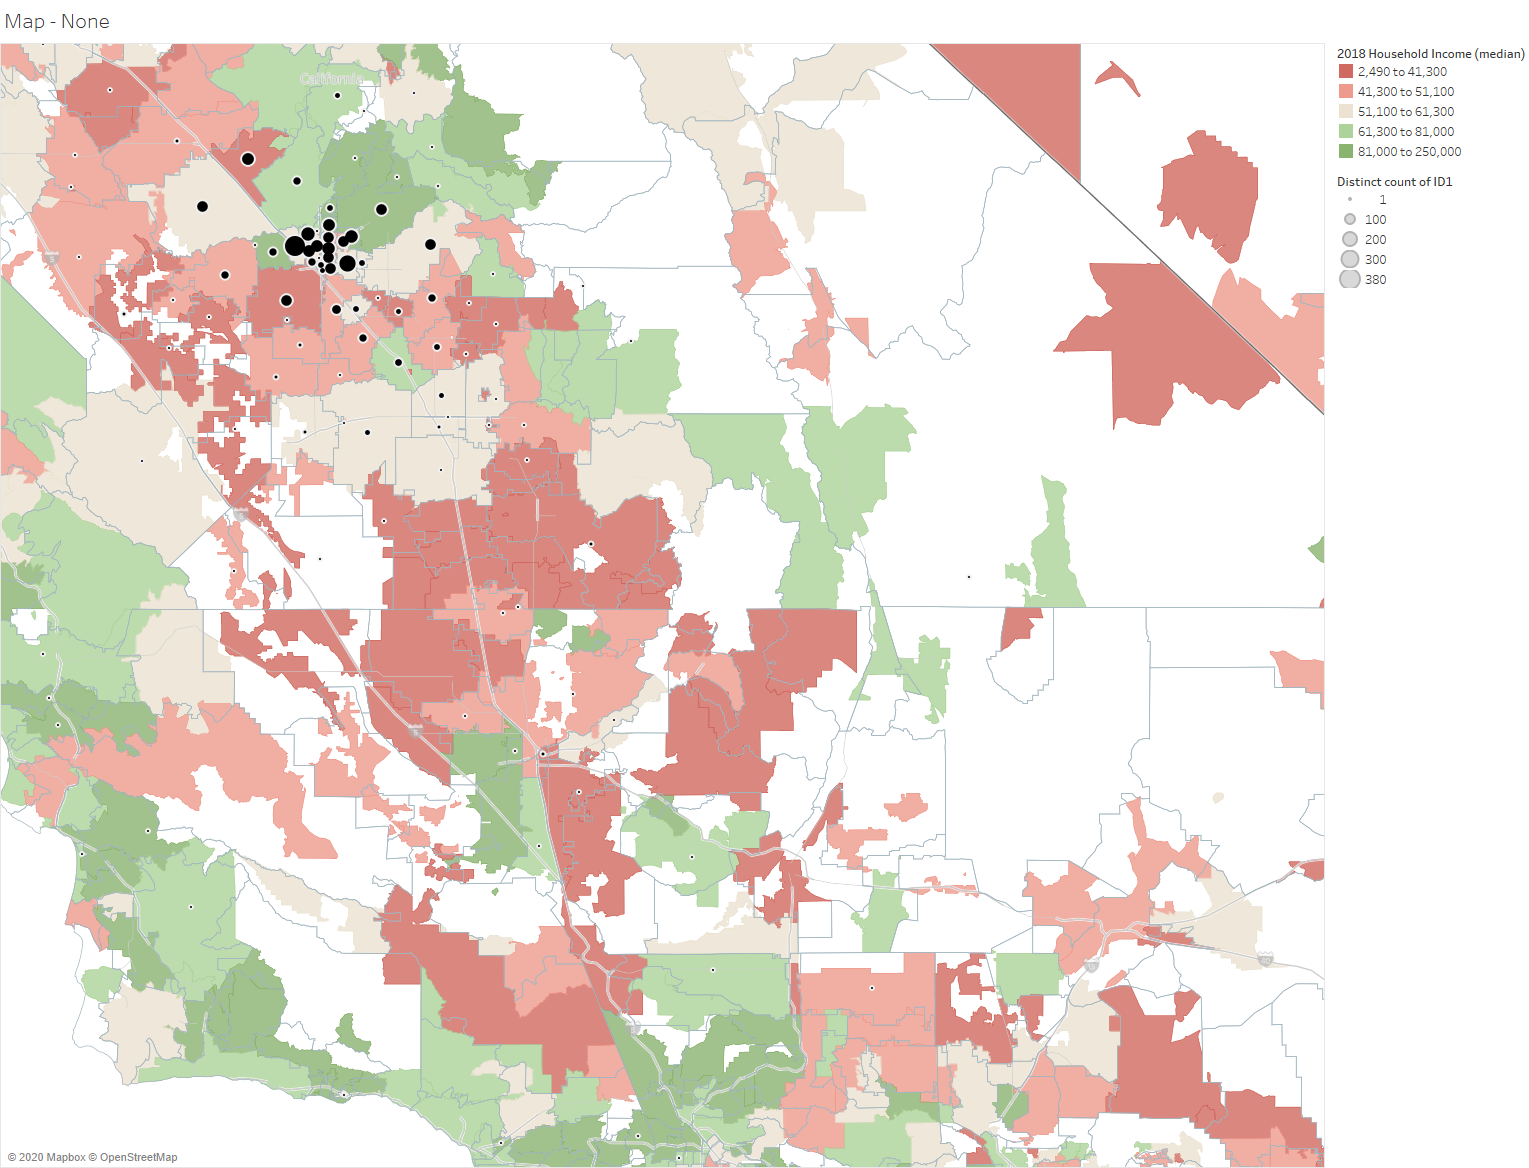
The map provides an analysis of students who did not submit an application. Of the students who did not submit an application, 798 students live in zip codes in with a low household income ($0-$42,100). Of 798 students in low-income zip codes, 82 attend full time, 102 three quarter time, 168 half time, and 446 less than half time.
| Income Status | Number of Students |
|---|---|
| Low-income | 798.00 |
| Low to mid-income | 802.00 |
| Other | 1,995.00 |
| Grand Total | 3,595.00 |
| Race / Ethnicity | Number of Students |
| African-American | 123 |
| American Indian/ Alaskan Native | 18 |
| Asian | 376 |
| Filipino | 27 |
| Hispanic | 1,962 |
| Multi-ethnicity | 147 |
| Pacific Islander | 7 |
| Unknown | 63 |
| White/ non-Hispanic | 872 |
| Grand Total | 3,595 |
| Tier 3 - Zip Code Income Status |
Full Time (>=12) |
Three Quarter Time (9-11.9) |
Half Time (6-8.9) |
Less than Half Time (<- 5.9) |
Grand Total |
| Low-income | 82 | 102 | 168 | 446 | 798 |
| Low to mid-income | 105 | 96 | 156 | 445 | 802 |
| Other | 366 | 296 | 401 | 932 | 1,995 |
| Grand Total | 553 | 494 | 725 | 1,823 | 3,595 |
It is recommended that the distribution of funds be in four tiers. Pell eligible, No Pell, No Pell (EFC>=$30,000)+ No application other*, No application (identified low income zip code).
| Type | Full-time | Three-quarter time | Half-time | Less than half-time | Total |
|
Tier 1-Pell eligible (EFC<$5,776) |
4,402 | 2,432 | 2,194 | 1,904 | 10,932 |
| Tier 2-No Pell (EFC<$30,000) | 724 | 419 | 424 | 406 | 1,973 |
| Tier 3-No Pell (EFC>=$30,000)+ No application other* | 2,947 | ||||
| Tier 4-No application (identified low income zip code) | 82 | 102 | 168 | 446 | 798 |
| Total | 16,650 |
| Type | Full-time | Three-quarter time | Half-time | Less than half-time |
| Tier 1-Pell eligible (EFC<$5,776) | $600 | $450 | $300 | $175 |
| Tier 2-No Pell (EFC<$30,000) | $350 | $300 | $250 | $150 |
| Tier 3-No Pell (EFC>=$30,000)+ No application other* | $150 | $150 | $150 | $150 |
| Tier 4-No application (identified low income zip code) | $350 | $300 | $250 | $150 |
| Type | Full-time | Three-quarter time | Half-time | Less than half-time | Total |
| Tier 1-Pell eligible (EFC<$5,776) | $2,641,200 | $1,094,400 | $658,200 | $333,200 | $4,727,000 |
| Tier 2-No Pell (EFC<$30,000) | $253,400 | $125,700 | $106,000 | $60,900 | $546,000 |
| Tier 3-No Pell (EFC>=$30,000)+ No application other* | $442,050 | ||||
| Tier 4-No application (identified low income zip code) | $28,700 | $30,600 | $42,000 | $66,900 | $168,200 |
| Total | $5,883,250 |
"No Pell" students includes those who did not receive a Pell Grant and Fee waiver only students but applied for aid.
Enrollment as of 4-14-20
*No application other includes students that have not submitted an application and do not have an identified low income zip code. In addtion this group includes students with an Expected Family Contribution (EFC) greater than $30,000.00.